Using 3D technology to extend your 2D maps allows you to present your information in a more realistic manner. In this lesson, you'll experience the power of 3D for yourself. You will assume the role of the director of the Parks and Recreation department for Portland, Oregon. You are presenting an urban tree management plan to the city council for approval. One of your responsibilities is urban tree management for the city. Trees are vital to an urban environment as they, among other things, provide needed shade for pedestrians during hot, sunny days and minimize water runoff during heavy rainfall.
Your department has collected tree data with location and size attributes of each tree in the city. Using this data, you will present a comprehensive plan to the city council outlining your department’s vision for urban tree management. Unfortunately, you don't have 3D models of the trees. However, you recently learned that you can use Scene Viewer to convert your 2D tree data into realistic-looking 3D trees highlighting the spatial relationships between the trees and urban elements, such as buildings. Re-creating the trees, buildings, and streets of Portland in 3D in Scene Viewer will help the city council understand current urban conditions and make more informed decisions. Throughout this scenario, you'll be guided through the following skills: creating a scene, adding data to a scene, changing symbols with 3D styles, capturing slides, and saving the scene. This lesson is designed for beginners—anyone who is new to ArcGIS Enterprise, GIS, or 3D. To complete the entire lesson, you must sign in to the portal as member of a role that has privileges to create content. If you do not have privileges to create content, skip the section Save the scene. Estimated time: 20 minutes.
Search for location
To create the scene, sign in and search for a location in Portland, Oregon, as described in the following steps:
- Open your portal and sign in.
- Once you're signed in, click Scene at the top of the site to open Scene Viewer.
- Click New Scene in the gallery.
A new scene opens.
- Zoom with the navigation controls or use your mouse wheel. You can also navigate the scene using the mouse buttons to pan and rotate.
Next, you'll zoom to the location you want.
- Click the Search button
 . In the Search box, type Japanese American Historical Plaza, Portland, OR and press Enter.
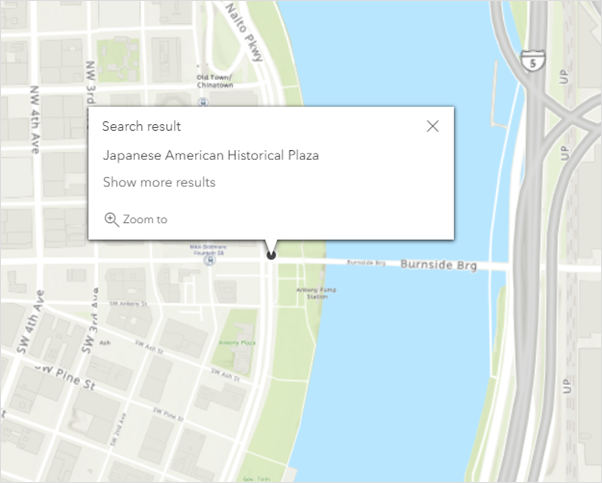
The scene zooms in to the Japanese American Historical Plaza in Portland, Oregon.
Add a 2D data layer to a new scene
The 2D tree data that your team collected for downtown Portland is critical for planning and visualization because it contains the tree location and attributes such as species, plant date, and diameter. You'll add a public feature layer from ArcGIS Online to use in your scene. As you move around your scene, you will start to see how your 2D points interact with the 3D terrain.
- If necessary, click the Modify scene button
 to open the Designer pane.
 - Click
 Add Layers .
You'll be adding layers from ArcGIS Online.
- Click Add Layers in the Designer pane.
- Click Enter Layer URL.
- Paste the following URL into the Layer URL field:
https://www.portlandmaps.com/arcgis/rest/services/Public/COP_OpenData/MapServer/25
- Type PortlandTrees in the Layer Name field and click Add.
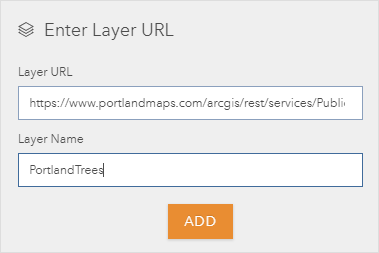
The tree layer is added to the scene as 2D points. Scene Viewer automatically zooms to the extent of the layer.
Change your 2D points to 3D objects
Use the tree layer attributes to turn the points into authentic-looking trees with real-world sizes. Apply a layer style with 3D symbols that use realistic size differences and are colored by tree type to gain a better understanding of tree patterns and behavior in an urban setting.
- Pan and rotate the scene to explore the PortlandTrees layer.
- In the Designer pane, click PortlandTrees to change layer style.
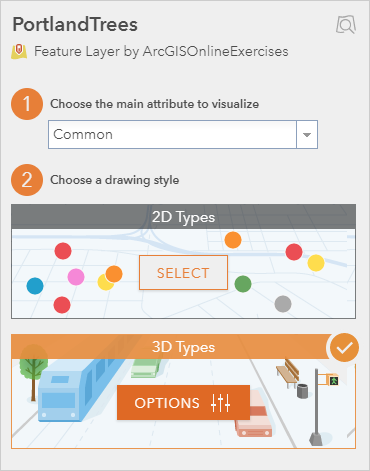
- For Choose the main attribute to visualize, choose Common to style your trees by the common tree type name.
Note:
If you choose a numeric attribute from the list, you can style the trees more thematically with the 3D Counts and Amounts style that uses proportional symbols and color. - For Choose a drawing style, click Select to change the selected style to 3D Types and apply it to the scene.
- Toggle on the rotate tool by clicking the rotate button
 in the scene.
 - Zoom in and rotate the scene to observe your changes.
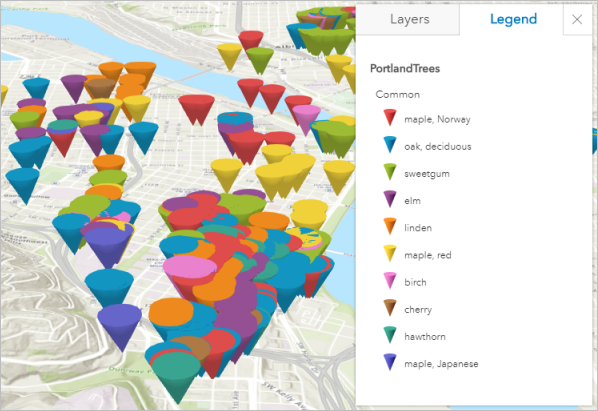
The 2D circles changed to default 3D cones representing Portland's trees. These are 3D object symbols with real-world dimensions.
Next, you'll change these 3D cones to custom tree symbols that can be visualized in Scene Viewer.
Change symbols to trees
To change the cones to custom tree symbols, complete the following steps:
- In the Layer Style pane, click Options to open and modify the 3D Types style.
- Click select all at the top of the list of common tree types.
For the purposes of this lesson, you'll apply a single tree style to all the common tree types. With the 3D Types style, you can give each tree type a unique tree style, if you have time.
- Click Marker.
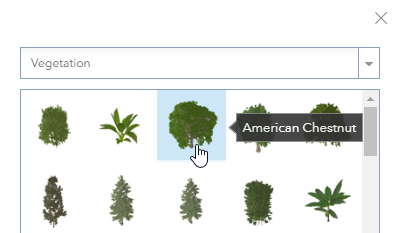
- In the window that appears, change the symbol category from Basic Shapes to Vegetation.
The symbol options change to a wide variety of tree styles.
- Click the American Chestnut symbol as shown in the following image:
- Click Done.
The cones have changed to realistic trees.
- Click Color and apply a color palette that contains lighter colors.
Next, you'll apply different sizes to the trees to represent their relative sizes.
- Scroll down to the All markers section. For Size, choose DBH.
- If necessary, change the unit to ft. Leave all other settings unchanged. Zoom to the trees and navigate the scene again.
The color and size of the trees have changed.
- Click Done twice to return to the Designer pane.
Add an additional layer with transparency
The last layer you will add to your scene to give it context contains 3D models of downtown buildings in Portland. After you add the buildings, you will see the trees and their spatial relationship to the buildings, which give a realistic representation of the Portland urban environment.
- Click
 Add Layers, click Enter Layer URL, and paste the following URL into the Layer URL field:
https://services2.arcgis.com/j80Jz20at6Bi0thr/arcgis/rest/services/PortlandBuildings/SceneServer
- Click Add to add the PortlandBuildings layer to your scene.
- Navigate around the scene. Zoom out some so you can see more trees and buildings in the city.
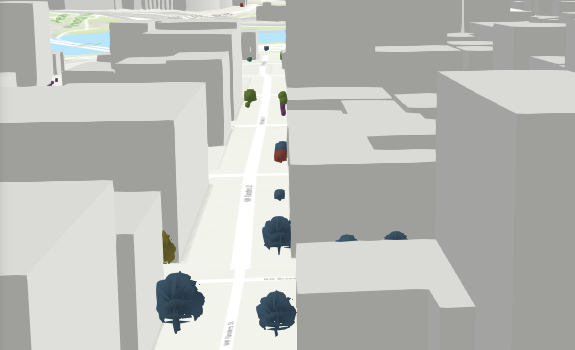
With the buildings added, you may notice that it is more difficult to see the trees among the buildings. You'll set a transparency on the buildings so the trees are more visible and easier for your audience to identify.
- To set transparency in the PortlandBuildings layer, click the layer options button
 and choose Layers Properties.
 - Under Transparency, set the transparency to 50 percent so you can see the trees.
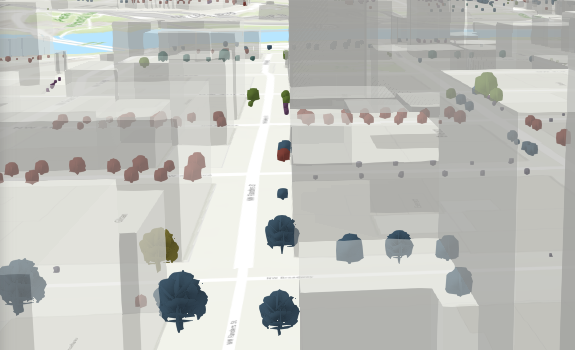
- Click Done twice to return to the Designer pane.
Capture a slide
When presenting your plan to the city, you want to present your ideas in such a way that council members can quickly understand and grasp the key concepts needed to drive decision making. Use scene slides to focus your story and intuitively guide viewers through highlights of your scene. Slides are like bookmarks and allow you to quickly navigate to important points of your scene that indicate where tree landscaping is sufficient and perhaps where more tree planting is needed.
- Zoom, pan, and rotate the scene to show the viewpoint and extent you want to capture. Find an area where there are a lot of trees.
- Click Slides.
- In the Slides pane, click
 Capture Slide.
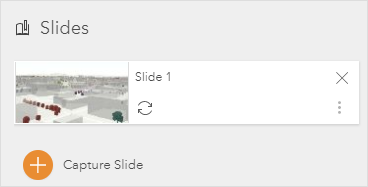
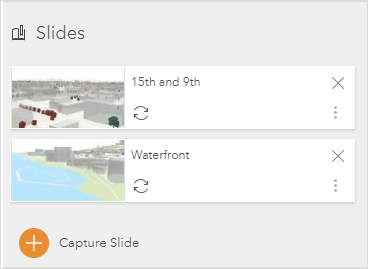
The slide is added to the Slides pane with a thumbnail and a default name. The slide also appears below the scene when you point to the scene.
- Click Slide 1 and rename it to a name that is appropriate to the slide you created.
- Zoom and find a pedestrian area along the waterfront that could use additional trees for shade cover.
- Click Capture Slide to add a second slide.
- Rename the slide Waterfront.
- Click Done.
Note:
If you don't like the way a slide looks, you can click the Remove Slide button  to delete it. Additionally, you can navigate to a new extent and click the Update Slide button
  to change the slide.
Save the scene
Now you can save the scene to share with others in your department or members of the city council. Furthermore, in the future, you could also embed the scene in your department's website and create a 3D web app or story map to share with the public.
- Before you save the scene, adjust the scene to the viewpoint you want for the thumbnail of the scene.
- Click Save Scene.
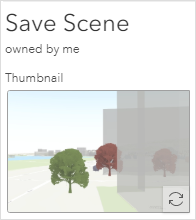
If you don't like the thumbnail, you can capture a different viewpoint.
- Provide a title, summary, and tags, and click Save.
Your scene is saved and is ready to be shared with others.
Next steps
Using Scene Viewer, in less than 20 minutes, you've taken 2D tree data with location and sizes, added a few layer options, and created a compelling 3D visualization of the urban tree environment for Portland, Oregon. Viewers can use this scene to make informed decisions about urban tree management issues, such as where there are enough trees and, alternatively, where additional tree planting is needed.
As mentioned in the previous section, you can create an app that contains your scene and offers the tools that app users need to explore the scene.
To find more scenario-based lessons, browse Learn ArcGIS. You can also visit The ArcGIS Book and The ArcGIS Imagery Book websites.